Get an Inside Look at Intraday Trends for Timing Your Trades,
Checking Bullishness or Bearishness, and Forecasting Market Moves
Compare seasonal charts with intraday prices to plan trades:
- quickly gain a better understanding of how a market reacts to price moves to identify entries, exits, and new trades
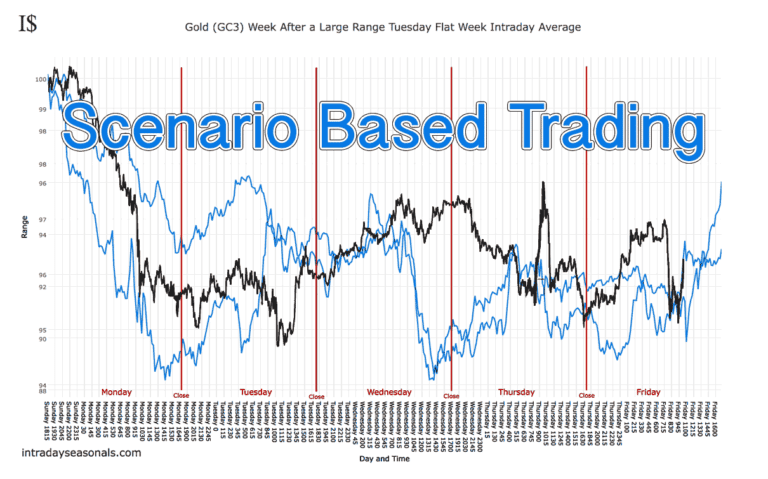
- know the historic effect of the largest range day (LRD) of the week on the weeks before, during, and after
- precisely forecast by combining trends with the LRD of the week
- have insights into intraday moves without a costly data purchase
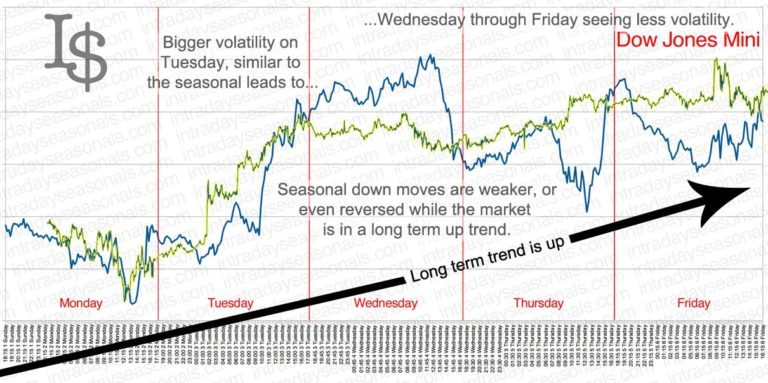
- verify if the market is similar to–or diverging from–the past
Legendary Trader Larry Williams says,
“This is just awesome…a lot of detail here!”
“Intraday Seasonals is just awesome… watch to see how close these patterns are replicated in the future.” – Larry Williams
Another trader says, “The quality of these charts is brilliantly done. Simple, neat, organized & presented most effectively to be used as a quick visual reference tool.” – James A.
Revealed to the public in 2013 during a webinar with Larry Williams and Jake Bernstein, Intraday Seasonals continues to be a favorite forecasting tool of professional traders, authors, and analysts.
Join Larry and traders around the world in using Intraday Seasonals to help plan your trades.

“I will watch to see how close these patterns are replicated in the future.”
-Larry Williams
Use Intraday Seasonals in 3 Easy Steps
Intraday Seasonals can help you plan your trades days and weeks in advance.
Step 1
Become an Intraday Seasonals Member and access 70 different scenario charts for every market.
Step 2
Match the market to a specific scenario. Did the week prior close more than 25% above the open, or was it down? Flat? Which day had the largest range? Identify key components of the week and see what kind of week tends to follow. You can also simply find the chart that best matches the previous week and plan that way.
Step 3
Plan your trades. With times and trends charted out you can better decide when and how you might enter and exit your trades. As the week progresses, check for further trend confirmation or possible new scenarios.
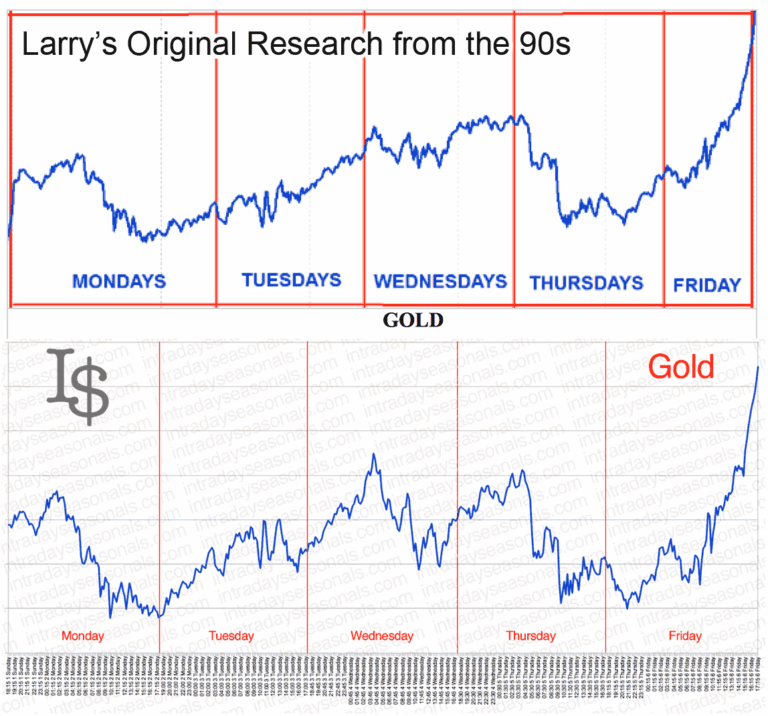
Tracking Intraday Tendencies Since the 90s
Larry’s Original Insight
Intraday Seasonals began from an original Larry Williams’ idea. He started showing them to traders in the mid 1990’s. With Larry’s help, and approval, we take this to a new level.
Lasting Price Patterns
Even when comparing intraday price movement to decades into the past even the updated research plots similarly to the intraday cycle forecast data mined when Larry began to show these patterns to a few select traders. While changes do take place over time the markets still have underlying tendencies that endure for many years. Our updated charts provide a quick way to understand a market’s personality.
The Intraday Seasonals Enhancement
In our unique addition to intraday research–not found in Larry’s original work or in the intraday charts of other trading software–we calculate how markets cycle in different scenarios. For each market you get 70 scenario based charts combining the effects of the weekly trend as well as the largest range day of the week. It’s important to note, these are the average moves made within the markets on an intraday basis in aggregate over the last decade–electronically traded markets and modern market hours. They are best used as a complement to trends and specific scenarios for timing purposes.